Vibration measurement with 20x SYSCOM MR3003TRs over the week-end
The Swiss Federal Institute of Technology (ETH) is building the new HPQ laboratory and office building housing highly sensitive laboratories for experimental research.
Vibration measurements were carried out on the base of the excavation on floor Y (-25 m) and on the floor slab A (-15m) as an interim check in order to determine the actual noise level and to adjust the parameters for the elastic bedding of the labs.
The main sources of vibration are traffic (bus of public transport – red circle in the picture below),
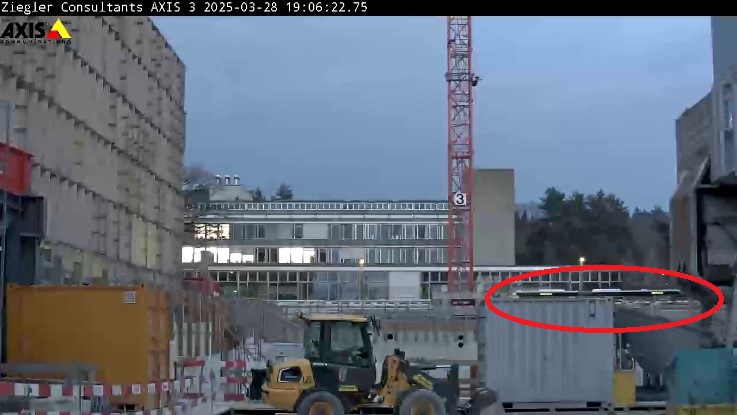
the nearby testing hall of the department of civil engineering and surprisingly the wind induced movement of another nearby lab building.
The picture below shows the excavation pit with the position of some of the sensors.
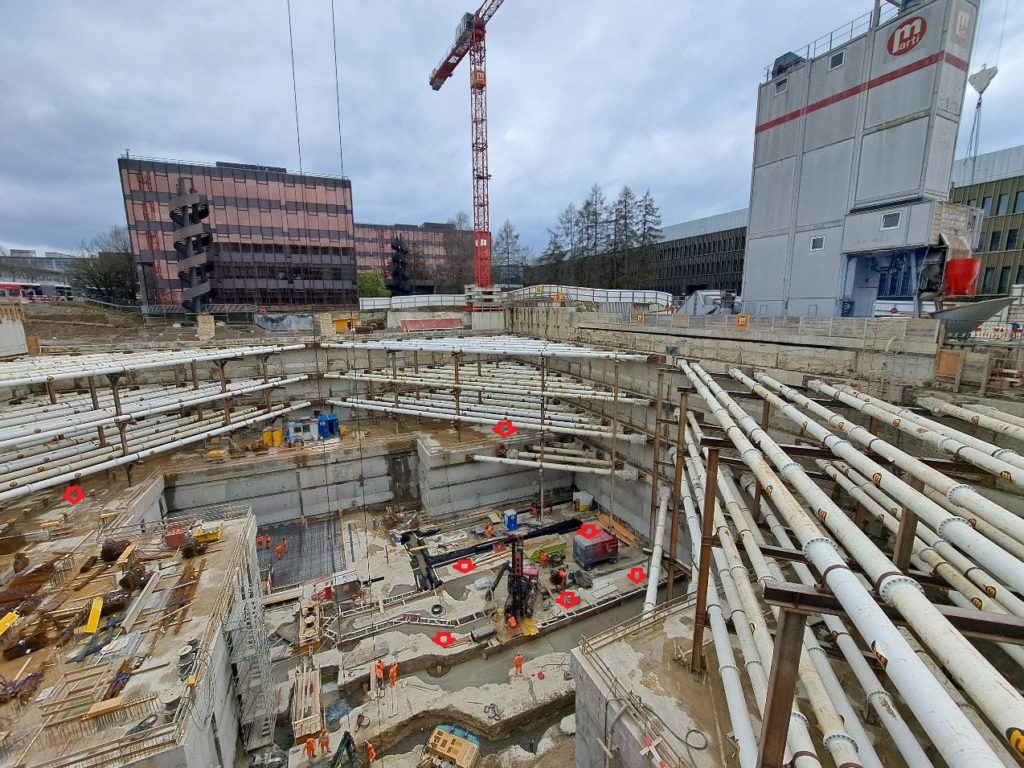
The installation of the equipment was made on Thursday afternoon – fortunately, we could count on the support of the construction company for the installation of the measuring equipment – 2 pallets full of measuring equipment were transported into the excavation pit by crane.
The analysis of the recordings was made using a mutually agreed method, basically using third octave spectra of overlapping windows of 6 seconds duration. Together with the elastic bedding of the labs a noise level lower than VC-G must be achieved- for details see Evolving criteria for research facilities: I – Vibration – Hal Amick, Michael Gendreau, Todd Busch, and Colin Gordon – Colin Gordon & Associates, San Bruno, CA.
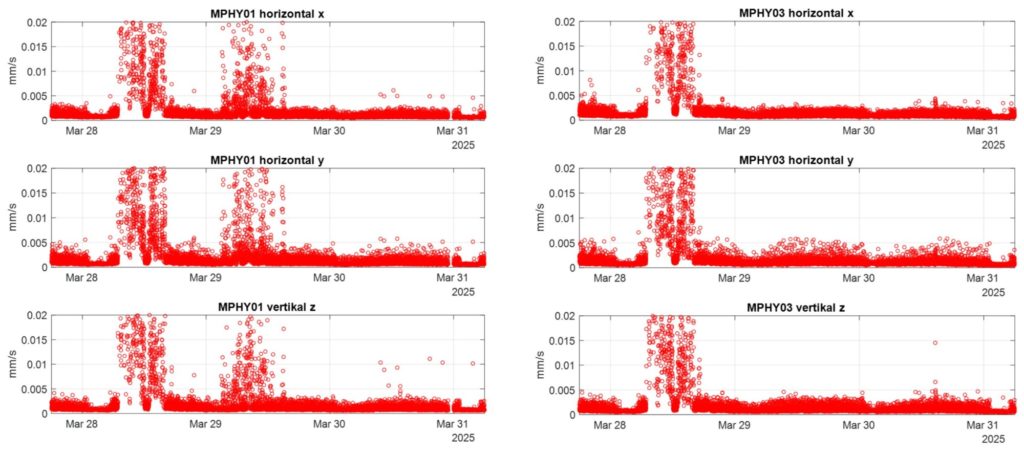
The figure below shows the 30 second peak values of the vibration velocity in mm/s of a typical measuring point in the excavation pit. After a very quiet night from Thursday, March 28 to Friday, March 29, vibrations from the construction site became dominant. Raindrops on March 30 caused peaks at sensor MPHY01, which was exposed. Sensor MPHY03 was sheltered by a box and remained unaffected. The night from Saturday, March 30 to Sunday, March 31 was noisier than the previous one due to windy weather.
The figure below shows the comparison with the required criteria (red curve) for the 2nd day.
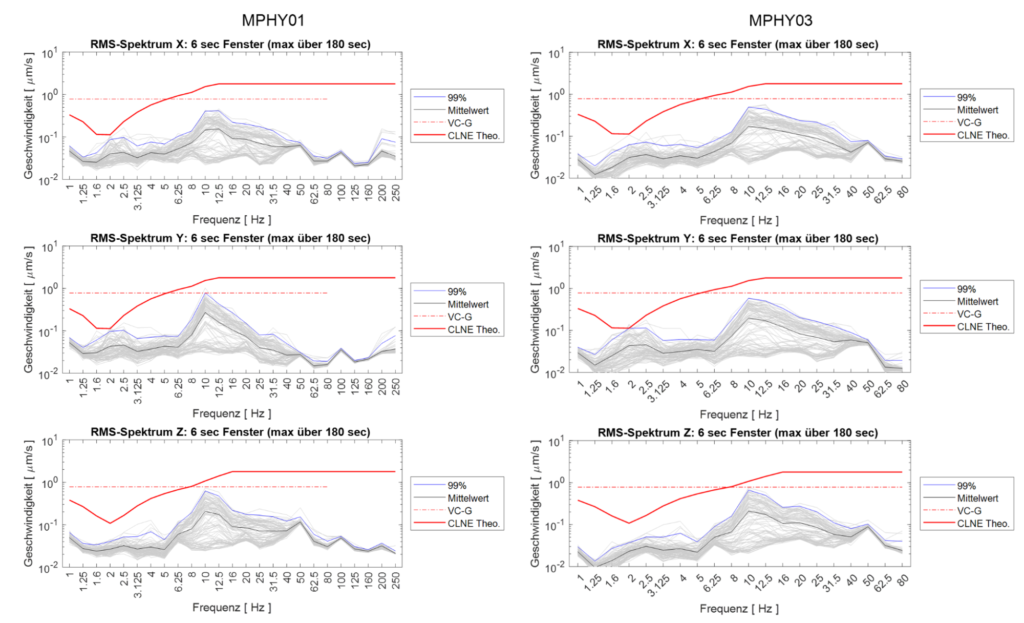
The measurements show that the desired low vibration level is within reach – the most significant vibration input is due to the buses (8-10 Hz) and surprisingly to the wind (2.5 Hz) shaking the nearby buildings.